You can understand Sensors without treating it as magic or memorizing a long list of terms. Start with one simple mental model, connect each part to an everyday example, and then add the technical details that make the system dependable.
The big idea: A sensor does not simply produce truth: it converts a physical quantity into a signal that must be sampled, calibrated and checked.
Always record the unit, conditions and uncertainty. A number without context is not yet a trustworthy measurement.
Why this matters
Every automated system depends on measurements. A sensor value is useful only when its range, sampling, accuracy, noise and calibration are understood well enough for the decision that follows.
By the end of this guide, you will be able to:
- Trace a physical quantity through a transducer to a digital reading
- Distinguish range, resolution, accuracy, precision and sampling rate
- Apply simple calibration and noise-reduction methods
- Design a fair sensor comparison with recorded evidence
The goal is not only to recognize the words. It is to explain the system, predict what it will do, and design a small test that produces evidence.
1. From physical change to signal
The question: How does a sensor turn the world into data?
A sensor contains a transducer whose electrical property changes with a physical quantity such as light, force, temperature or distance. Signal conditioning may amplify, limit or filter the result. The controller then reads a voltage, pulse timing or digital message and converts it into a value with a unit.
Think of it like this: A translator changes a message into a language the listener understands; the meaning should survive the conversion.
A concrete example
An ultrasonic range sensor sends a sound pulse, measures echo time and uses the speed of sound to estimate distance in centimetres.
The flow: Physical quantity → Transducer signal → Conditioning → Value with unit
Try it yourself
- Choose light, temperature and distance sensors.
- Name the input quantity and electrical output for each.
- Draw one complete measurement chain.
Quick check — Why must a measurement include a unit?
The unit tells what scale the number uses; 25 could mean degrees Celsius, centimetres or something else.
2. Range, resolution and sampling
The question: How much detail can a measurement contain?
Range is the interval a sensor can measure. Resolution is the smallest change the measurement system can represent. An analog-to-digital converter divides its input range into codes: a 10-bit converter has 1,024 possible codes. Sampling rate says how often readings are taken; sampling too slowly can hide fast changes.
Think of it like this: A ruler’s length is its range, its smallest marking is its resolution, and how often you look at it is the sampling rate.
A concrete example
An ideal 10-bit converter across 0–5 V has steps of about 5 ÷ 1,024 = 0.0049 V, but noise and sensor quality can make the useful detail worse.
The flow: Input range → Sample in time → Quantize to code → Store reading
Try it yourself
- Draw a smooth changing signal.
- Mark ten evenly timed samples.
- Round each height to four levels and notice what detail disappears.
Quick check — Does finer ADC resolution guarantee an accurate sensor?
No. Resolution describes representable steps; accuracy also depends on calibration, reference quality, noise and the sensor itself.
3. Accuracy, calibration and noise
The question: How can repeated readings become more trustworthy?
Accuracy describes closeness to an accepted reference, while precision describes how closely repeated readings agree. Calibration compares readings with known references and creates a correction. Noise causes short-term variation; shielding, grounding, filtering and averaging can help, but heavy smoothing also delays real change.
Think of it like this: Arrows clustered away from the bullseye are precise but inaccurate; scattered arrows around the bullseye may average accurately but lack precision.
A concrete example
A temperature sensor reads 1.8 °C high at two reference points, so subtracting the measured offset improves results within the tested range.
The flow: Reference value → Repeated readings → Find error → Apply correction
Try it yourself
- Take ten readings of one unchanging object or use sample data.
- Calculate the average and spread.
- Apply a known offset, then state what the calibration does not prove.
Quick check — Can averaging remove a fixed calibration offset?
No. Averaging can reduce random variation, but a consistent bias needs calibration or another correction.
4. Validate a sensing system
The question: How do engineers know a sensor is suitable for a job?
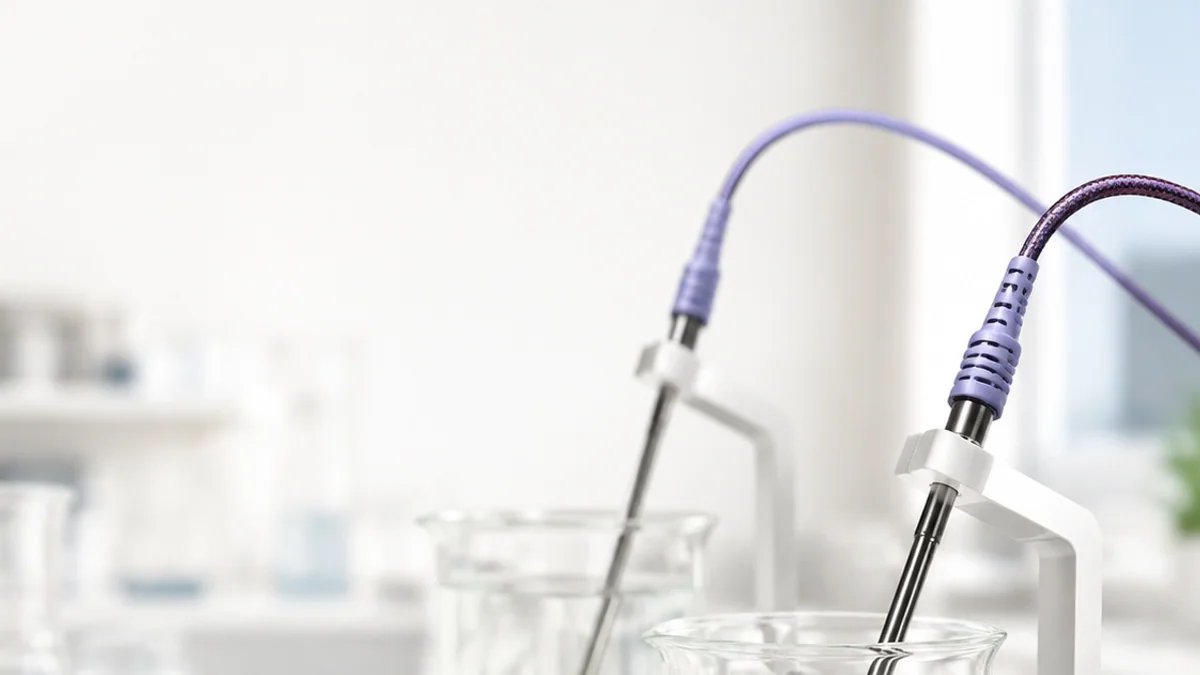
A sensor should be tested across the required range and real conditions, not only at one convenient point. Validation checks response time, repeatability, limits, missing data and unreasonable values. Combining different sensors can improve confidence, but only when their units, timestamps, locations and failure modes are understood.
Think of it like this: A weather report is stronger when a thermometer, rain gauge and observation agree, but repeating the same faulty reading does not create truth.
A concrete example
Compare a distance sensor at 10, 30, 60 and 100 cm on dark, bright and angled targets, then graph error and mark where readings fail.
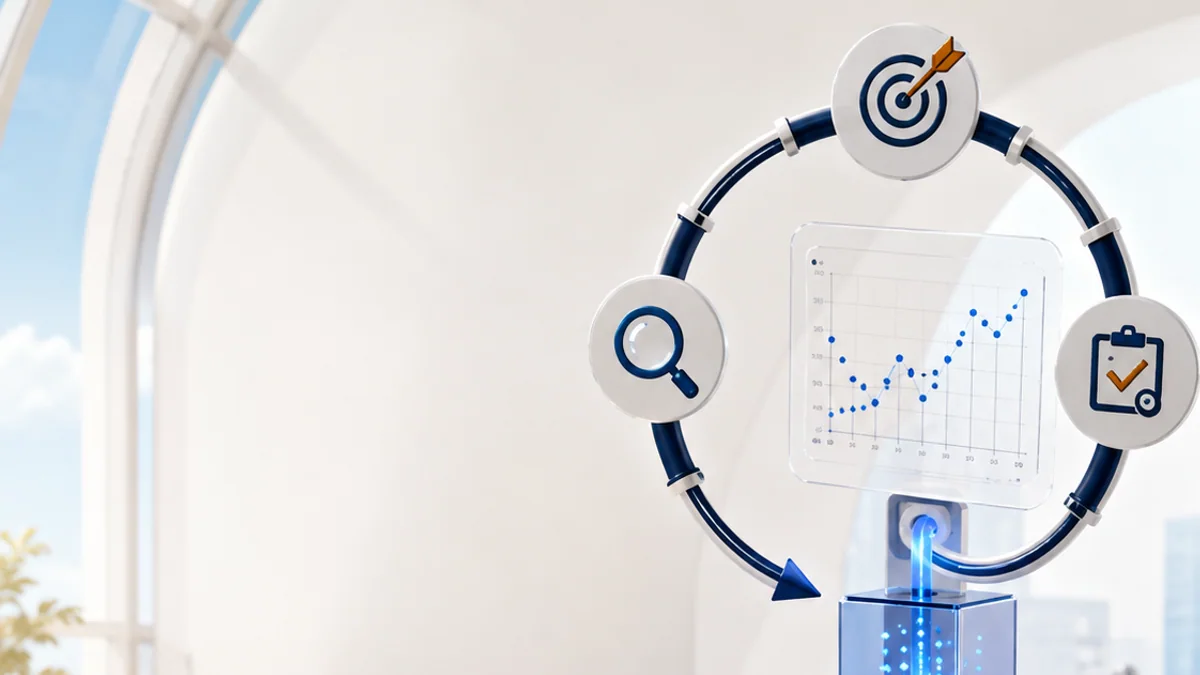
The flow: Define requirement → Test conditions → Compare reference → Accept or improve
Try it yourself
- Write a requirement for a classroom temperature or distance sensor.
- Create a table of reference values and conditions.
- Add tests for disconnected, out-of-range and rapidly changing input.
Quick check — Why test at several points across the range?
A sensor’s error may change with input, so one good reading cannot prove performance everywhere.
Put the ideas together: Build a sensor validation lab
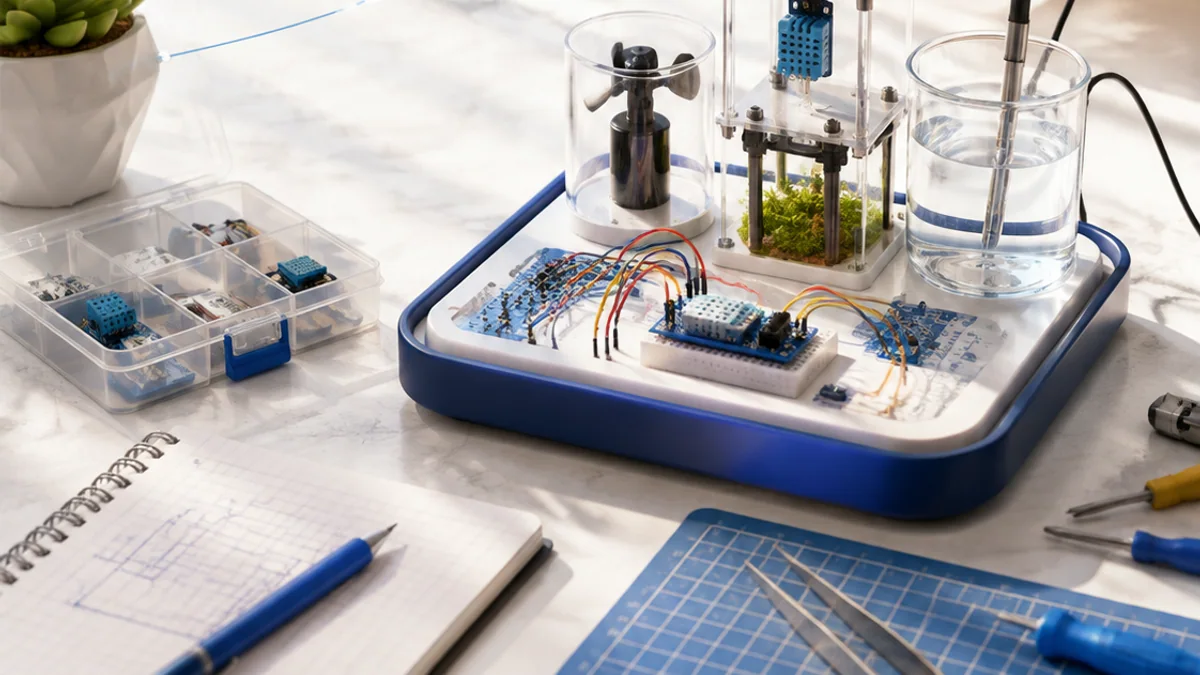
Plan and, if hardware is available, run a fair comparison of a sensor against known reference values and real operating conditions.
Your build plan
- Define the quantity, range, unit and required accuracy.
- Choose reference points and repeat each measurement.
- Graph error and identify noise, bias and failure regions.
- Recommend calibration, filtering or a different sensor.
Evidence to keep
- Measurement-chain diagram
- Timestamped data table with units
- Reference-versus-reading graph
- Evidence-based sensor recommendation
An engineer does not stop at “it worked once.” Keep the diagram, record the conditions, repeat the test, and note what changed between attempts.
Important safety and quality notes
- Use low-voltage educational sensors and verify supply and signal limits.
- Disconnect power before changing wiring.
- Do not use student projects to measure safety-critical, medical or mains-electric quantities.
- Treat unexpected values as possible faults before using them to control an actuator.
The examples in this article are educational models. Check component ratings, manufacturer instructions, local rules and appropriate supervision before using real hardware.
Vocabulary without the jargon wall
| Term | Plain-language meaning |
|---|---|
| Transducer | A device that converts one form of physical quantity or energy into another signal. |
| Range | The interval between the minimum and maximum measurable values. |
| Resolution | The smallest change a measurement system can represent. |
| Accuracy | Closeness of a result to an accepted reference value. |
| Precision | Closeness of repeated results to one another. |
| Calibration | Comparison with known references to estimate and correct measurement error. |
What to remember
A sensor does not simply produce truth: it converts a physical quantity into a signal that must be sampled, calibrated and checked. The professional habit behind the technology is equally important: define the result, observe the system, measure what happened, and improve one thing at a time.
Continue with the full Sensors learning path for the structured sessions, or explore the sources below when you are ready for deeper technical detail.
Sources and further learning
- Arduino built-in examples: analog input, calibration and smoothing — Arduino
- Arduino analog I/O language reference — Arduino
- SI units information — National Institute of Standards and Technology
Calibrate a sensor reading
Apply an offset and a gain to a raw reading, then compare the corrected result.
Move a slider to explore the model.
Remember: this is a simplified learning model, not a hardware design or safety calculator. Real systems also include limits, noise, timing and failure handling.